ocalendar
Simplyfing event discovery
Role & Services
Visual Design
UI & UX Design
Timeline
3 months – 2024
Industry
Events
The events market in Brazil is significant, with the sector generating R$ 291.1 billion in 2023, contributing approximately 3.8% to the country's GDP. This growth was driven by a complete return to post-pandemic activities and a high demand for in-person and hybrid events.
The pandemic initially posed a challenge, causing a massive loss of R$ 230 billion in revenue between 2020 and 2021. However, it also accelerated the evolution of virtual experiences, turning homes into venues for cultural events and enabling cultural engagement to continue online. This made more people get used to buying tickets online.
Overall, the Ziggo app has successfully enhanced TravelTech Innovations' product offering, positioning the company as a leader in smart travel technology. The app has received excellent reviews from users, highlighting its reliability, ease of use, and the added security it provides. As a result, TravelTech Innovations has seen increased customer loyalty and a growing user base, solidifying its reputation in the market.


How might we help event-goers have a better experience when searching for events?
We decided to focus on 3 categories at first:


As I got deeper into the project, I realized we needed a modular interface that could adapt seamlessly to different event data categories. Just like how LEGO lets you build everything from buildings to robots using the same pieces, our design had to be flexible enough to handle various types of event information within the same structure.
Before building the product, we needed to validate the idea, understand if people really faced the problems we identified, and learn more about how users search for events. So we conducted a survey to gather insights and determine which event categories people most cared about.
Not everything make it to the MVP, we had to remove and postpone some features.
Things started to change after the influx of new users and their feedback.
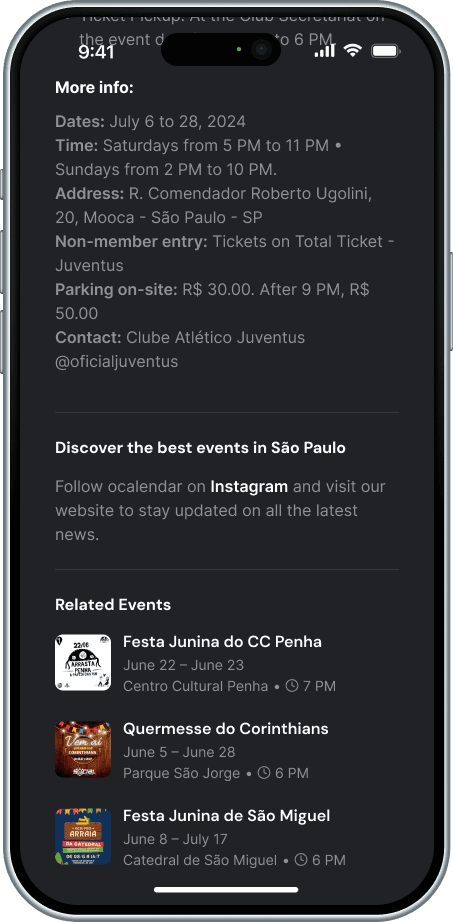
Adding this section to the event details page made it easy for users to discover similar events and explore other categories.
This improved our internal linking, enhancing their relevance to search engines and helping us rank among the top results for various events.
We initially hadn't planned this section, but adding it strategically at the end of the event details grew our social media presence, resulting in 152 new Instagram followers in a month.
After launching ocalendar, we saw an impressive increase in organic traffic, jumping from 310 users in May to over 10,000 in June. Page views followed a similar trend, showing that our SEO and design strategies increased user acquisition. Four months post-launch, we reached an average of over 30,000+ organic visits per month, and this growth continues as we expand into new event categories.
We are learning to adapt to the unique characteristics of each category while exploring ways to implement a monetization model soon. Feel free to check out our website at ocalendar.io!
Increase in Organic Traffic
From 310 users in May to 10,000+ in June.

2,042%
Increase in Page Views
2,200 in May to 19,000 page views in June
763%
Organic Search Traffic Sessions
419 in May to 12000 sessions in June